Data Visualisation Graph
Discrete Geometry 3D Viewer v.0.3.0
DGV Allows Data Visualisation via Images, Surfaces and Volume plots using OpenGL. Uses the Blitz++, VTK Visualisation and Open Source Qt Libraries. Discrete Geometry 3D Viewer is a small scientific visualization tool. It uses OpenGL to display line,
PyXPlot v.0.8.4
PyXPlot is a command-line data processing, graph plotting and vector graphics tool.
GraphData v.1.0
GraphData is designed to automatically extract numeric data from charts (bmp, gif, jpg, etc.), facilitating the work of extraction the numbers and increasing its accuracy.
GraphDiag v.1.00
The Library GraphDiag is intended for building graph and diagrams on HBITMAP, surface DirectDraw and in file BMP format. The Library can build the graphs on entered text line and diagrams, as from tables, which format is provided by developer,
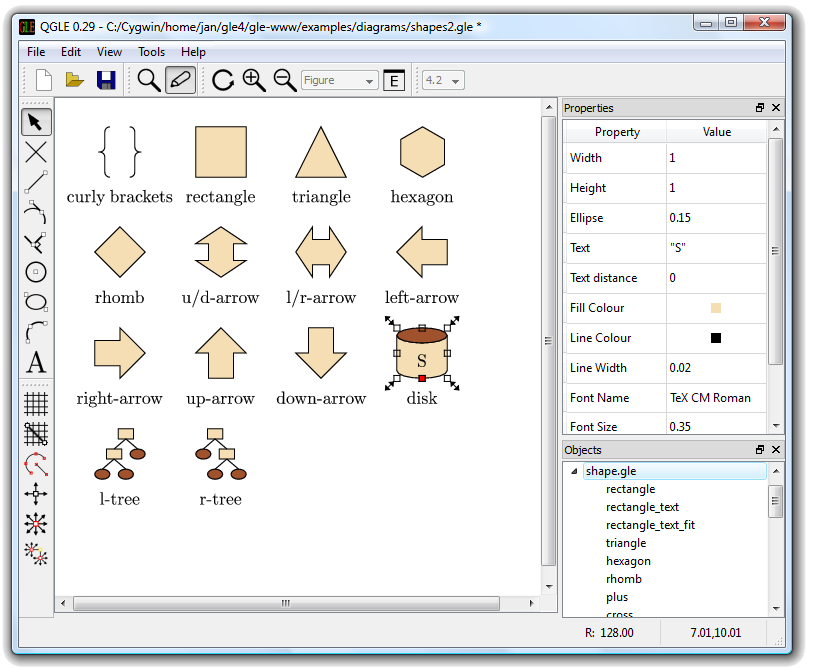
GLE for Mac OS X v.4.2.2004
GLE (Graphics Layout Engine) is a graphics scripting language designed for creating publication quality graphs, plots, diagrams, figures and slides.
Sharc Harpoon v.4 4
Harpoon is the ideal tool for delivering high quality meshes of even the most complex geometry. Fast and flexible, Harpoon's powerful geometry and mesh controls are driven through a simple and logical graphical user interface (GUI).
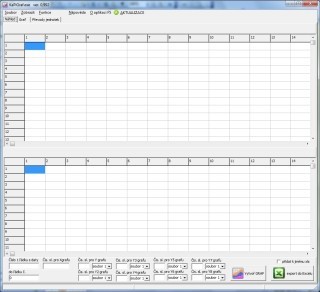
Graph construction program v.4.2.0
A useful tool for designing graphs. Graph construction software can be used to build a graph from manually entered values or draw a graph based on values of certain time period queried from selected Access database.First,
Teroid Windows Forms Graph v.1 1
Teroid Windows Forms Graph is a .NET Windows Forms control which draws a column, line or bar graph from an array of numerical data. Minimum and maximum values can be set to any value. Index marks and values can be shown on each axis.
CoSBiLab Graph v.1.0
Graph constructs, visualizes and modifies graphs as well as calculates measures and layouts. CoSBiLab Graph can construct, visualize and modify graphs as well as calculate measures and layouts.
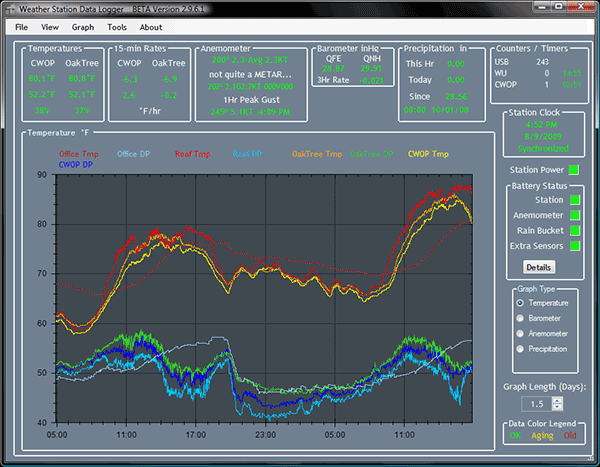
Weather Station Data Logger v.4.2.0.0
This Windows application will display and log weather data obtained through a USB connection to the Oregon Scientific WMR88, WMR100, WMR200 and RMS300 weather stations.
CITIZEN AQUALAND GRAPH Nx v.5.0
AQUALAND GRAPH Nx enables diving data stored in memory with CYBER AQUALAND Nx to be transferred to a personal computer using an infrared communication interface or communication unit (USB communication interface).